Have you ever tried to debug MSBuild project? If you did, in all probability you had to resort to introducing extra Message tasks into the project to output status during project execution; and then execute build and review the logs time after time to identify the problems (perhaps adding more Message tasks as you proceed).
Now you can debug your projects without ever adding extra "Message" tasks while reviewing build execution in real time – jut use MSBuild Sidekick debugger and resolve problems in your builds in no time.
In this post we shall show how to debug typical C# console project with MSBuild Sidekick.
1. Create new C# Console Application project with Visual Studio and open the project with MSBuild Sidekick.
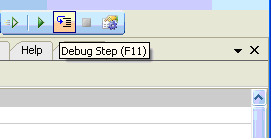
2. Click Debug Step button (or press F11 key) to start step-by-step debug.
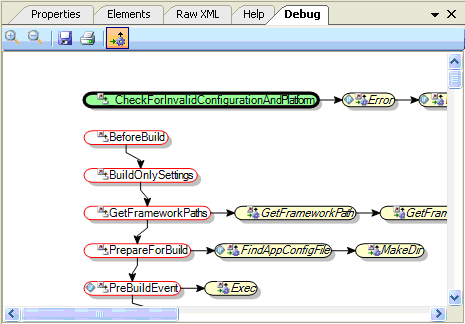
3. You can see now build execution order in Debug Window that should appear automatically. You may also open Debug Window by clicking on View -> Debug Window menu item.
Note: Debug window appears in floating mode when it is opened for the first time. To make Debug window docked drag-n-drop it at desired location on MSBuild Sidekick main application window.
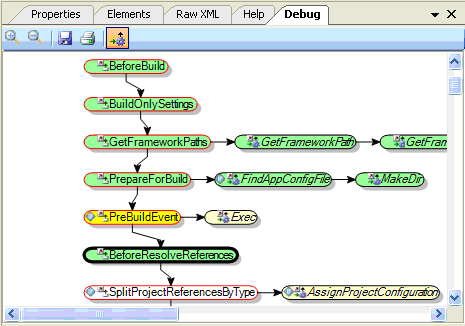
4. Once in Debug mode, you can debug step-by-step by clicking Debug Step button (or pressing F11 key). MSBuild Sidekick highlights diagram elements differently depending on their current status:
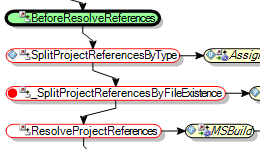
* Current Target \Task is always highlighted with bold border
* Targets\Tasks that were successfully executed are highlighted in green
* Targets\Tasks that were skipped are highlighted in yellow
* Targets\Tasks that are not yet processed are not highlighted
Note: You may always see color coding rules by expanding legend which is collapsed at bottom of Debug Window.
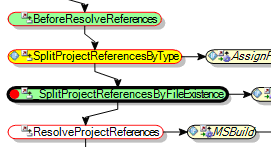
5. To stop build execution on a specific Target\Task you may set breakpoint on it. To set breakpoint for Target\Task open right-click context menu and choose Toggle Breakpoint item.
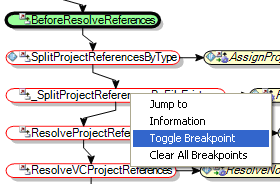
6. Target\Task with breakpoint becomes marked with red circle.
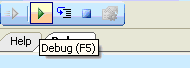
7. Click Debug button (or press F5 key) to continue debugging.
8. Once build execution reaches Target\Task with breakpoint set, MSBuild Sidekick will switch into step-by-step debug mode. Current Target/Task will be highlighted with bold border around it in Debug window.